Quick answer
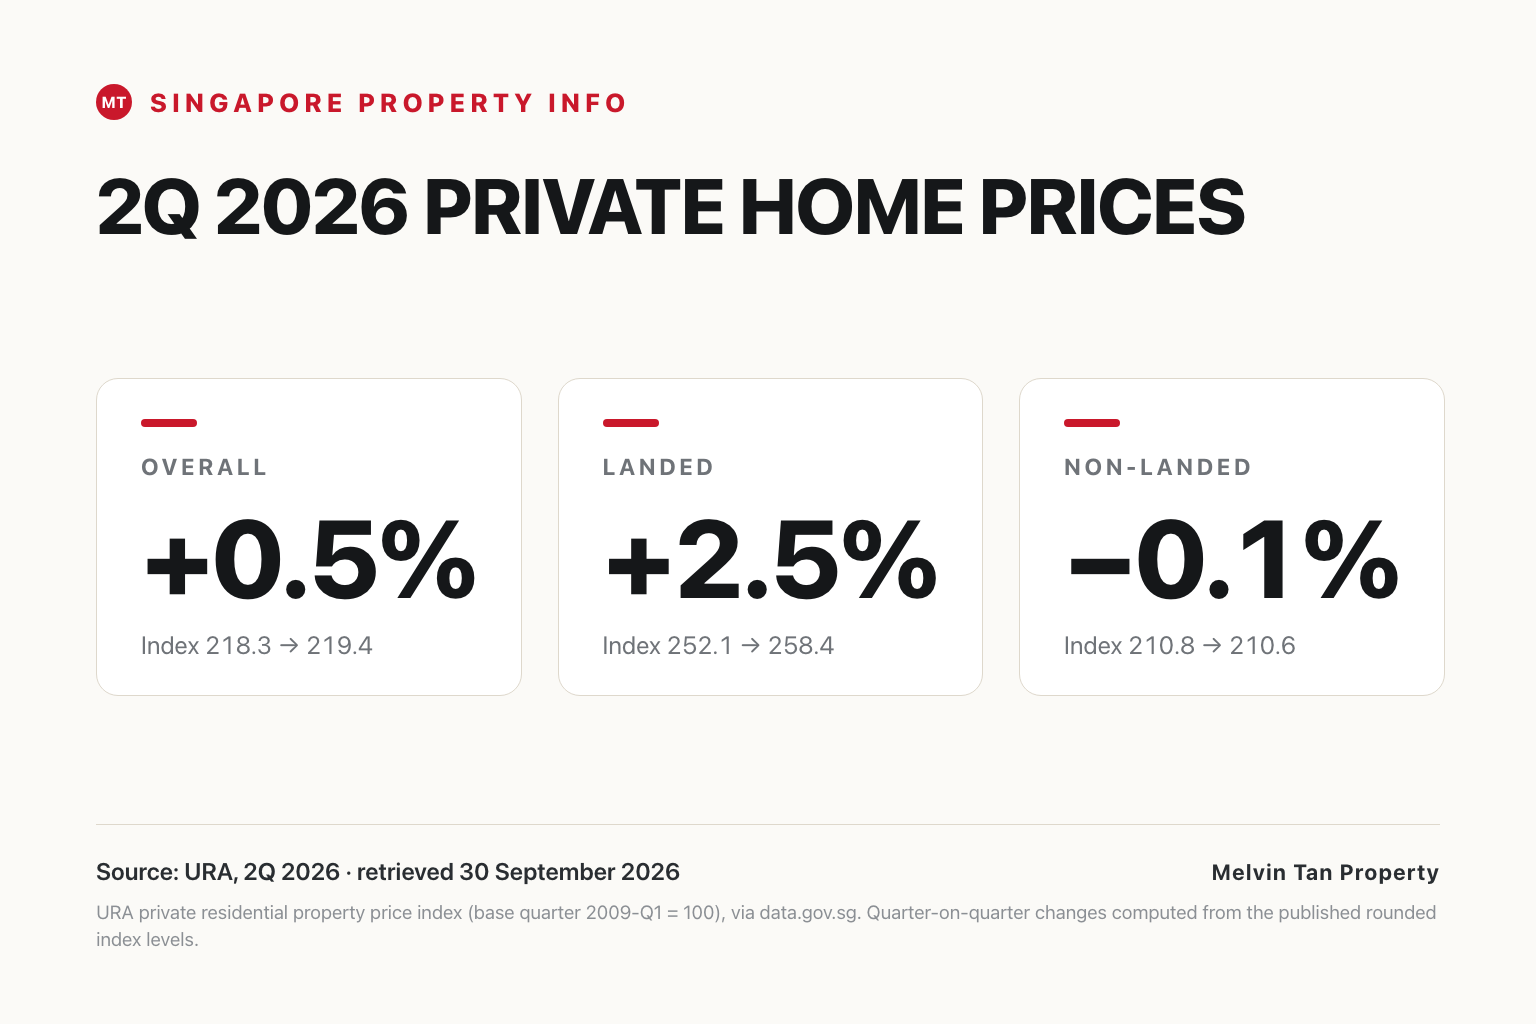
In 2Q 2026, URA data shows the overall private residential price index rose by about 0.5% from the previous quarter. The landed price index rose by about 2.5%, while the non-landed price index moved about −0.1%. These segment indices moved differently; the overall figure does not describe every property type.
The aggregate headline can therefore look stronger than the condo market on its own. For owners, buyers and upgraders, the practical step is to look at the evidence in your own property type, region and project rather than applying one national number to a very different market.
Key takeaways
- The overall private residential price index was 219.4 in 2Q 2026, up from 218.3 in 1Q 2026, a change of about 0.5%.
- The landed home price index rose from 252.1 to 258.4, a change of about 2.5%.
- The non-landed price index eased from 210.8 to 210.6, a change of about −0.1%.
- The overall index combines market segments whose price indices moved differently; it does not measure the price change of an individual condo or estate.
- URA reported 3,813 private residential resale transactions in 2Q 2026, up from 3,225 in 1Q 2026, so the divergence happened while resale activity remained active.
- The correct comparison for your property is recent evidence from the same type, region and project, not a single national index.
Background: one index, two very different markets
URA publishes a quarterly private residential price index (base quarter 2009-Q1 = 100). URA uses stratified hedonic regression to control for differences in transacted properties, such as age and unit size, and combines price movements using five-quarter fixed weights. It is not a median price, and it is not a valuation of any individual property.
The overall index combines landed and non-landed segments. Non-landed includes apartments, condominiums and executive condominiums more than ten years old. The index is not a simple average of the prices or number of homes sold in that quarter; these figures alone do not establish why either segment moved.
When the two sub-markets move in different directions, the aggregate figure can mask what is happening in the market you actually care about. That is the situation in 2Q 2026.
Official data snapshot: 2Q 2026
Price index by property type
| Index (2009-Q1 = 100) | 1Q 2026 | 2Q 2026 | Quarter-on-quarter |
|---|---|---|---|
| All residential | 218.3 | 219.4 | about +0.5% |
| Landed | 252.1 | 258.4 | about +2.5% |
| Non-landed | 210.8 | 210.6 | about −0.1% |
Source: URA private residential property price index, via data.gov.sg, as retrieved 30 September 2026. Quarter-on-quarter changes are computed from the published rounded index levels; URA’s own release may quote slightly different values.
Within the non-landed market, URA’s 24 July 2026 release reported that prices rose 1.8% in the Core Central Region, while they decreased 1.2% in the Rest of Central Region and 0.1% in the Outside Central Region. The broadly flat non-landed figure therefore summarises regional indices that moved in different directions.
On activity, URA recorded 3,813 private residential resale transactions in 2Q 2026, compared with 3,225 in 1Q 2026. New Sale transactions totalled 2,141 units: 16 completed and 2,125 uncompleted developer sales. This counts units sold, not units launched. These activity figures provide context but do not establish the cause of the price-index movements.
Why the aggregate number can mislead
Read the overall figure alongside its segment indices. Landed and non-landed indices moved differently, and the non-landed regional indices were also mixed. These observations do not explain the causes of the changes or quantify each segment’s contribution to the overall result. With an overall move of about 0.5%, a single quarter should not be read as a durable trend. One quarter of mixed signals is information, not a forecast.
The practical consequence is simple. The overall index is useful as background, but it is not a signal about your unit. A 0.5% rise in the aggregate can coexist with a flat or soft result in your exact estate, just as a strong landed quarter can coexist with a quiet market for mid-range condos.
What this may mean for private-home owners
Condo sellers
If your property is a condominium, the 2.5% landed rise is not evidence that your price should rise. Your market is the non-landed segment in your region and project. The relevant questions are what similar units in your building and nearby estates have actually transacted recently, how many comparable listings are active, and how your unit’s floor, orientation, layout and condition compare against them. In a flat aggregate market, presentation, pricing evidence and timing usually matter more than the headline.
Landed owners
The landed price index rose in 2Q 2026, but individual landed properties differ substantially. A headline index rise does not tell you what your specific plot, location and condition would command. Review comparable sales for differences in tenure, land area, property type and condition rather than treating the segment index as a valuation. Any decision to sell, hold or refinance should rest on evidence specific to the property, not on the segment index.
What this may mean for condo buyers and upgraders
For buyers, a flat non-landed quarter is not a signal to rush or to wait. It is an invitation to slow down and compare. Within the non-landed market, region matters: CCR, RCR and OCR were moving differently in the same quarter. Within a region, project matters. Your shortlist should be judged by the evidence at the project and street level: recent transactions, competing listings, unit mix, remaining lease and total cost including financing and applicable duties.
For households planning an upgrade, the sequencing question is often worth more than the index direction. If you need to sell an existing home before buying the next one, the conditions in each of your two markets, your loan position, CPF implications and temporary-housing needs should be reviewed together. A flat national index does not answer any of those questions.
A useful habit: compare your own segment
- Match the property type. Condo evidence supports condo decisions; landed evidence supports landed decisions.
- Match the region and, where possible, the project or street. Regional results differ within the same quarter.
- Use several recent comparables rather than one transaction. One sale is an observation, not a market.
- Check what is actively listed nearby, not just what has transacted.
- Treat a single quarter as context, not a trend. Direction matters more over several quarters.
- Review the full cost position: price, financing, applicable duties, CPF and moving costs.
FAQ
Official sources
- URA / data.gov.sg – Private Residential Property Price Index (Base Quarter 2009-Q1 = 100), Quarterly – retrieved 30 September 2026
- URA / data.gov.sg – Private Residential Property Transactions in the Whole of Singapore, Quarterly – retrieved 30 September 2026
- URA – Release of 2nd Quarter 2026 real estate statistics – 24 July 2026; regional figures independently checked 30 September 2026
- URA REALIS – Coverage and Methodology – checked 30 September 2026
This article provides general educational information based on official URA data. It does not value an individual property, predict future prices or replace legal, tax, CPF, mortgage or financial advice. Verify the latest official figures and project-level evidence before committing.