Quick answer
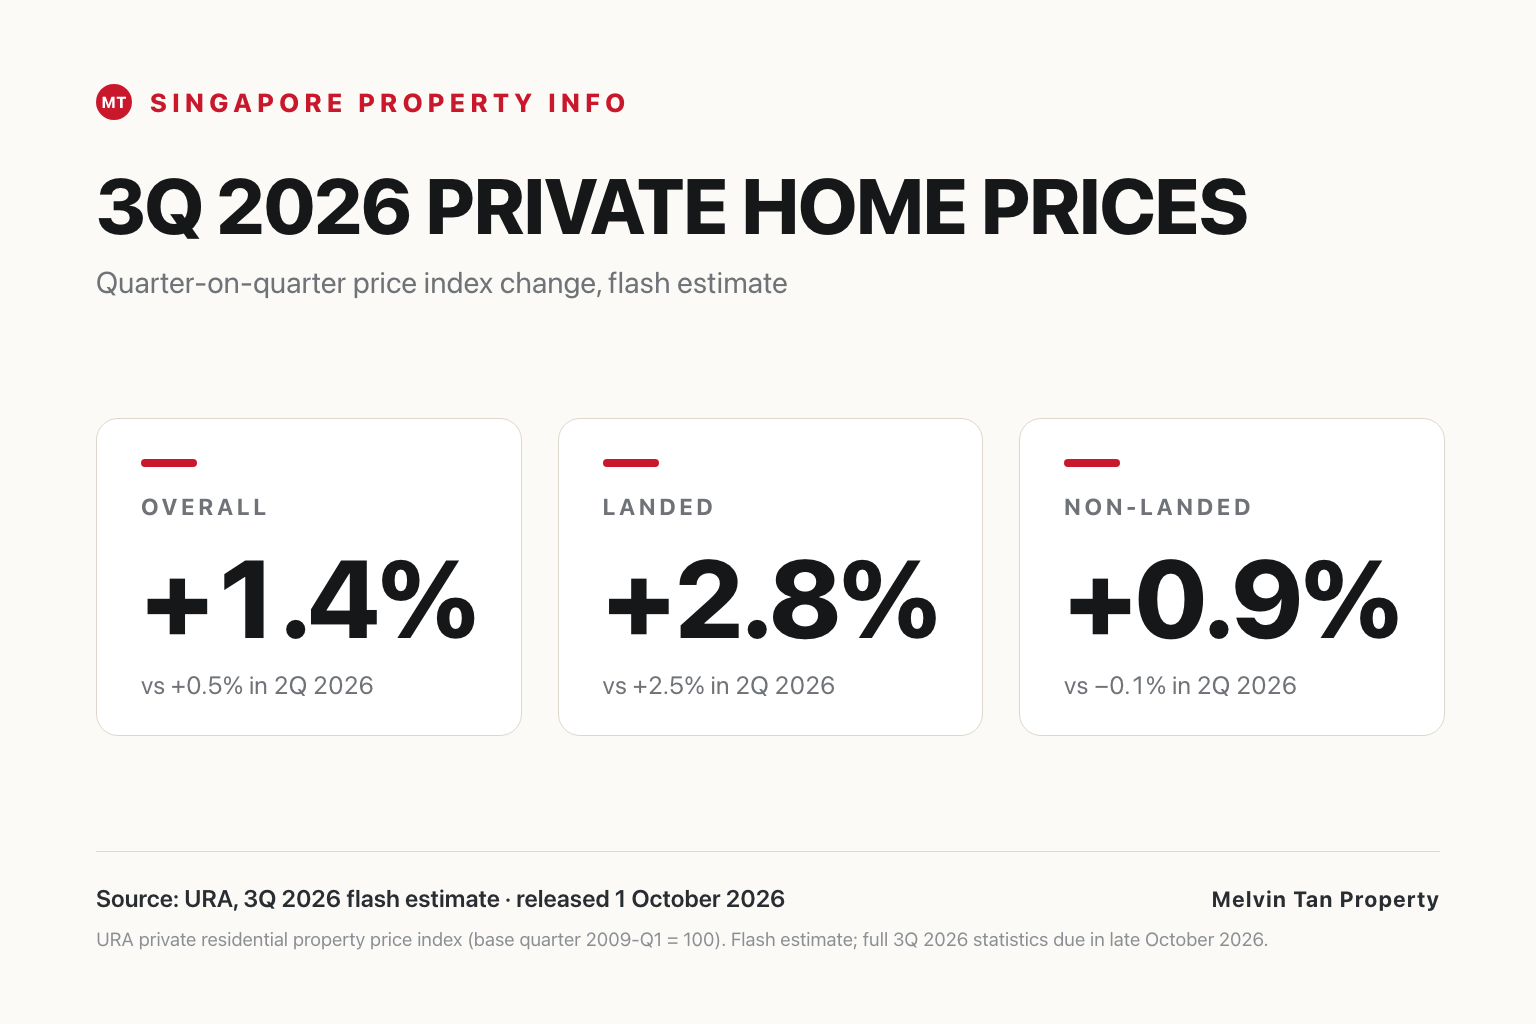
URA’s flash estimate released on 1 October 2026 shows the private residential price index rose 1.4% in 3Q 2026 from the previous quarter, with the landed price index up 2.8% and the non-landed price index up 0.9%. A flash estimate is a preliminary release: URA’s full 3Q 2026 real estate statistics are due on 23 October 2026 and may revise the flash figures.
While prices moved up, sale transactions slowed sharply: URA’s preliminary count was 4,296 sale transactions to mid-September 2026, down about 30% from 6,148 in 2Q 2026. The practical read for buyers, sellers and upgraders is to treat the flash figures as a first directional signal, not a final one, and to weigh the 4Q 2026 launch line-up before timing a move.
Key takeaways
- URA’s flash estimate puts the overall private residential price index up 1.4% in 3Q 2026, the largest quarterly rise in almost two years, following 0.5% in 2Q 2026.
- The landed price index rose 2.8%; the non-landed price index rose 0.9%, reversing the 0.1% decline in 2Q 2026.
- Within the non-landed market, regional movements were mixed: the Outside Central Region rose 2.2%, the Rest of Central Region rose 0.2%, and the Core Central Region eased 0.1%.
- Sale transactions slowed sharply. URA’s preliminary count was 4,296 sale transactions to mid-September 2026, down about 30% from 6,148 in 2Q 2026; separately, industry estimates put 3Q 2026 new-home sales at about 1,100 units (Huttons Data Analytics, as reported 1 October 2026), the weakest third quarter since 1998.
- The 4Q 2026 launch line-up is large. As of 5 October 2026, Lucerne Grand (570 units) and The Serra Residences (133 units) have already launched, and the 1,268-unit Thomson Reserve, Solano Grand (302 units) and The Island Residence (84 units) are still to launch.
- A flash estimate is preliminary: URA’s full 3Q 2026 real estate statistics are due on 23 October 2026 and may revise the preliminary figures.
What a flash estimate is (and is not)
URA releases a flash estimate shortly after each quarter closes, giving a preliminary read on the private residential price index before the full quarterly statistics are compiled. The flash estimate already includes the landed and non-landed price movements, the regional breakdown (Core Central, Rest of Central and Outside Central Regions) and preliminary sale-transaction volume; what it does not yet include is the complete quarterly real estate statistics, and the full release may revise the flash figures. For 3Q 2026, URA’s full real estate statistics are due on 23 October 2026. Until then, the flash figures should be treated as directional.
Context on the launch side: the 2Q 2026 official index stood at 219.4 (base quarter 2009-Q1 = 100), up 0.5% from 218.3 in 1Q 2026. URA publishes the official quarterly index levels; the 3Q 2026 flash release reports percentage changes, which is how the figures below are presented.
Official data snapshot: 3Q 2026 flash estimate
Price index change by property type
| Property type | 3Q 2026 (flash) | 2Q 2026 (official) |
|---|---|---|
| All residential | about +1.4% | about +0.5% (index 218.3 to 219.4) |
| Landed | about +2.8% | about +2.5% |
| Non-Landed | about +0.9% | about −0.1% |
3Q 2026: URA flash estimate, released 1 October 2026 (as reported 1 October 2026); preliminary until the full quarterly release. 2Q 2026: URA official data, via data.gov.sg, private residential property price index (base quarter 2009-Q1 = 100), retrieved 30 September 2026.
Non-landed price change by region, 3Q 2026 (flash)
| Region | 3Q 2026 (flash) |
|---|---|
| Core Central Region (Districts 9, 10, 11, Downtown Core, Sentosa) | about −0.1% |
| Rest of Central Region | about +0.2% |
| Outside Central Region | about +2.2% |
URA flash estimate, released 1 October 2026; preliminary until the full quarterly release. Regional breakdown as reported for the flash estimate.
Prices rose while sales slowed
The headline pairing in the flash data is price movement against activity. On price, the overall index rose 1.4%, with the landed segment leading and non-landed regional results mixed. On activity, URA’s own preliminary count in the flash release was 4,296 sale transactions in 3Q 2026 (through mid-September), versus 6,148 in 2Q 2026 — about 30% lower quarter on quarter across the primary and secondary markets combined. Within that, industry estimates (Huttons Data Analytics, as reported 1 October 2026) put 3Q 2026 new-home sales at about 1,100 units, down about 49% from the previous quarter and the weakest third-quarter result since 1998; launched supply was estimated at about 1,100 units, down about 38% from the previous quarter. Note the scope difference: URA’s 4,296 counts all private residential sale transactions (primary and secondary markets), while the 1,100 figure covers developer new-home sales only. Huttons attributed the weaker launch count partly to the Lunar Seventh Month and reported that buyers also paused while digesting recent policy changes.
Two further observations from the reporting around the flash estimate: Realion noted that the share of private homes (excluding executive condominiums) sold at $2 million or more rose from 49.2% in 2Q 2026 to 53.6% in 3Q 2026, and that private home prices had risen 2.8% in the first nine months of 2026; in the new-sale market, the share of transactions at $2 million or more rose from 52.3% to 71.7% over the same period. And on the HDB side, HDB’s flash estimate published the same day showed resale prices dipping 0.2% quarter on quarter for a third consecutive quarter, while resale transactions rose 17.7% to 7,528 units. The 15-month wait-out period for private property owners and ex-private property owners buying non-subsidised flats was removed on 28 July 2026, earlier in the quarter; the reporting links the volume increase to that policy change, but no authoritative source establishes that it caused the entire increase.
What 4Q 2026 may bring
The launch line-up into the final quarter is heavy, and it is already materialising. The 570-unit Lucerne Grand (CDL) launched at the start of October 2026 and sold 61.4% of units in the first three days at an average of $2,480 psf; the freehold 133-unit The Serra Residences (Far East Organization) priced on 2 October 2026 from $3,120 psf. Still to launch: the 1,268-unit Thomson Reserve (UOL, SingLand and CapitaLand Development, 99-year lease), Solano Grand (CDL, 302 units, 99-year lease) and The Island Residence (Keppel Land, 84 units, 99-year lease) — all estimated for the rest of the quarter, per the line-up reported 1 October 2026 (URA, Huttons Data Analytics). Analysts reported that the volume, and the city-fringe pricing expected at the largest of the remaining projects, could influence the overall price index in 4Q 2026, while a 25-basis-point US Federal Reserve rate increase in September 2026 (to 3.75%–4.00%) and possible further rises may temper some buyer urgency.
For the full year, one analyst estimate (SRI, as reported 1 October 2026) puts 2026 private residential price growth at about 3% to 3.5%, broadly in line with 2025’s 3.3%. These are analyst projections, not official figures.
What this may mean for private-home owners
Sellers
A rising flash index is background, not an offer. The 1.4% overall gain and the 2.8% landed gain describe the market as a whole; the evidence that matters for your home is the recent comparable transactions in your project or street, the active listings around it, and how your unit’s floor, orientation, layout and condition compare. If the quarter’s main story is price strength with thinner sales activity, the discipline to price on evidence rather than headlines becomes more important, because fewer sales means fewer recent benchmarks to lean on.
Buyers and upgraders
The 4Q 2026 launch line-up gives buyers more choice than in the first three quarters, including freehold options and large-scale city-fringe supply, and means competition for the same units may look different project by project. Two of the quarter’s major projects have already launched, with more to follow later in the quarter. For an upgrade, the two-market sequencing question remains: the conditions in the property you would sell, the market for the property you would buy, financing, CPF and temporary-housing needs, reviewed together. A flash estimate does not answer those questions; project-level evidence does.
A useful habit: wait for the full release
- Treat the flash estimate as directional: the full 3Q 2026 real estate statistics are due on 23 October 2026 and may revise the preliminary figures.
- Separate price and activity. A quarter can show rising prices and thinner sales at the same time; each has different implications for timing.
- Match the segment. Landed, CCR, RCR and OCR moved differently within the same quarter; your segment’s result is the relevant one.
- Use the launch line-up as information: what has launched near you, what is launching next, at what prices, and when — before deciding how to time a sale or purchase.
- Review financing and the full cost position, including applicable duties, CPF and moving costs, before committing.
FAQ
Official sources
- URA – Real estate statistics (3Q 2026 flash estimate released 1 October 2026; full 3Q 2026 real estate statistics due 23 October 2026)
- HDB – Resale flash estimate, 1 October 2026
- EdgeProp Singapore – Private home prices rise 1.4% despite weakest 3Q new-home sales since 1998: URA flash estimates – 1 October 2026
- EdgeProp Singapore – HDB resale prices dip 0.2% q-o-q in 3Q2026, while transaction volumes surge: HDB flash estimates – 1 October 2026
- URA / data.gov.sg – Private Residential Property Price Index (Base Quarter 2009-Q1 = 100), Quarterly – retrieved 30 September 2026 (2Q 2026 baseline)
This article provides general educational information based on official URA and HDB flash estimates and the reporting around them. It does not value an individual property, predict future prices or replace legal, tax, CPF, mortgage or financial advice. Verify the full official 3Q 2026 statistics and project-level evidence before committing.